10 Infrastructure Monitoring Best Practices for 2025
Soraxus Assistant
January 5, 2026 • 27 min read
In a high-stakes operational environment, infrastructure is not merely a cost center; it is the bedrock of every critical service, from mission-critical SaaS platforms to global gaming communities. As systems scale in complexity, spanning bare-metal servers, colocation facilities, and globally distributed architectures, the challenge of maintaining uptime and performance intensifies. Simply reacting to outages is an outdated and costly strategy. Modern resilience demands a proactive, multi-layered approach to observability, security, and management. Effective infrastructure monitoring best practices are the key to transitioning from a reactive, break-fix cycle to a predictive, self-healing operational model.
This comprehensive guide moves beyond surface-level advice to provide actionable strategies tailored for teams managing high-performance, dedicated infrastructure. We will detail 10 essential practices designed to help DevOps, SRE, and network engineering teams build a truly robust foundation. You will learn how to implement intelligent alerting that reduces noise, deploy multi-layer DDoS defenses, and establish meaningful performance baselines for accurate capacity planning. We will also cover crucial operational disciplines, including creating effective runbooks, automating health checks, and validating your resilience through rigorous disaster recovery drills and chaos engineering.
Each practice is broken down into specific, implementable steps that provide a clear roadmap for enhancing system reliability and security. Following these guidelines will enable your organization to detect issues before they impact users, respond to incidents with precision, and scale your infrastructure with confidence. By mastering these techniques, you will build a monitoring framework that not only prevents downtime but also drives continuous improvement and operational excellence, ensuring your services remain performant and available under any condition.
1. Implement Comprehensive Real-Time Monitoring and Intelligent Alerting Strategies
The foundation of any robust infrastructure management strategy is the ability to see what’s happening across your entire technology stack in real time. Comprehensive monitoring involves collecting telemetry data, including metrics, logs, and traces, from every component of your environment. This includes physical servers, network devices, operating systems, and the applications running on them. The goal is to move from a reactive, break-fix model to a proactive one where you can identify and resolve issues before they impact users.
Effective real-time monitoring is not just about data collection; it’s about turning that data into actionable intelligence through a smart alerting strategy. An intelligent alerting system filters out noise, groups related events, and notifies the right teams with the right context, drastically reducing Mean Time To Resolution (MTTR). This is a critical component of modern infrastructure monitoring best practices, ensuring that your team's attention is focused on genuine, service-impacting problems rather than false positives.

Actionable Tips for Implementation
- Establish Tiered, Dynamic Thresholds: Don't rely on static, arbitrary numbers. Analyze historical data to set dynamic baselines for your key metrics. Implement a tiered alerting system:
- Warning: A CPU utilization of 85% might trigger a low-priority alert visible on a dashboard or in a team chat channel.
- Critical: Crossing a 95% CPU threshold for more than five minutes should page the on-call engineer directly.
- Prevent Alert Fatigue: Notification overload is a real problem that leads to missed critical alerts. Use tools that support alert deduplication and grouping. For example, if 20 web servers simultaneously experience high latency due to a database issue, the on-call team should receive one single, correlated alert about the database, not 20 separate ones.
- Integrate Runbooks Directly: Every alert should include a link to a runbook or a knowledge base article. This empowers the on-call engineer to begin remediation immediately without needing to hunt for documentation, which is especially crucial during off-hours incidents.
- Monitor the Monitor: Your monitoring and alerting infrastructure is a critical service. Ensure it is highly available and redundant, potentially using out-of-band management networks so you can still receive alerts even if your primary production network is down.
2. Establish Multi-Layer DDoS Mitigation and Detection
In today's threat landscape, infrastructure monitoring must extend beyond performance and availability to include robust security-aware practices. Distributed Denial-of-Service (DDoS) attacks are no longer a rare event but a constant operational risk. Proactive monitoring involves deploying coordinated defenses across network layers 3 through 7 to detect and neutralize these attacks before they can impact your origin servers and degrade service for legitimate users. This multi-layer approach is crucial for distinguishing malicious traffic from legitimate user activity, especially during high-volume events.
A core tenet of modern infrastructure monitoring best practices is integrating security telemetry directly into your observability platform. This means not just tracking bandwidth and latency but actively analyzing traffic patterns to identify the signatures of both volumetric and sophisticated application-layer attacks. By implementing an always-on, multi-layer mitigation strategy, organizations can scrub malicious traffic through globally distributed centers, ensuring services like gaming platforms, SaaS applications, and e-commerce sites remain online and performant even under direct assault.

Actionable Tips for Implementation
- Establish Baseline Traffic Profiles: You cannot detect anomalies without a clear definition of normal. Use your monitoring tools to build detailed, historical profiles of your network traffic during standard operations. This allows your detection systems to more accurately identify sudden, illegitimate spikes characteristic of a DDoS attack. For a deeper dive, you can explore various techniques to mitigate DDoS attacks on Soraxus.com.
- Implement Application-Specific Rules: A one-size-fits-all approach to DDoS protection is ineffective. Configure distinct detection rules and rate-limiting policies for different services. For example, a gaming server expects rapid, short-lived UDP connections, while a web API expects structured HTTP requests; your mitigation rules must reflect these unique traffic patterns.
- Leverage Geo-IP Filtering and Rate Limiting: As a first line of defense, block traffic from geographic regions where you have no legitimate customers. At the application layer (Layer 7), implement strict rate limiting on API endpoints and login pages to defend against bots and credential-stuffing attacks that often precede or accompany a larger DDoS event.
- Monitor Your Mitigation Service: Your DDoS mitigation provider is a critical part of your infrastructure. Monitor its health, latency, and effectiveness as rigorously as you monitor your own origin servers. Ensure your provider offers transparent reporting and that its status is integrated into your primary dashboards so you can verify its performance during an attack.
3. Design Infrastructure with Redundancy and Geographic Distribution
A fundamental principle of resilient architecture is avoiding single points of failure. Designing for redundancy involves distributing infrastructure components across multiple data centers, availability zones, and geographic regions. This strategy ensures that a localized failure, whether it's a facility-level power outage, a network carrier issue, or a regional natural disaster, does not result in a catastrophic service disruption for your end-users. This approach is critical for any service that demands high availability, from enterprise SaaS platforms to global gaming networks.
Monitoring a geographically distributed footprint is a core component of modern infrastructure monitoring best practices. It requires a unified view of performance and health across all locations to make intelligent traffic-steering decisions and automate failover. For instance, a financial services firm might use an active-active architecture across two cities; effective monitoring confirms that both sites are healthy and can instantly trigger a traffic shift if one site's latency metrics degrade, protecting transactional integrity and customer experience.
Actionable Tips for Implementation
- Start with a Primary/Failover Model: Begin your journey into geographic distribution with a two-region setup: a primary location for active traffic and a secondary for disaster recovery. This simplifies state synchronization and operational complexity before scaling to a more complex multi-region active-active model. For businesses considering this step, understanding the cost of colocation in different regions is an essential part of the planning process.
- Automate Regional Failover: Rely on automated health checks and DNS or BGP-based traffic steering to manage failover. Manual intervention is too slow and error-prone during a real incident. Your monitoring system should be the source of truth that triggers these automated responses when predefined health thresholds are breached.
- Implement Distributed Tracing: To understand user experience in a distributed system, you must trace requests as they travel across regions and services. Distributed tracing helps pinpoint latency bottlenecks, such as a slow database replica in one region impacting global application performance.
- Test Failover Processes Relentlessly: Schedule and execute regional failover tests at least quarterly. These "game day" exercises are the only way to validate that your automation, runbooks, and team responses work as designed. They uncover hidden dependencies and process gaps before a real emergency does.
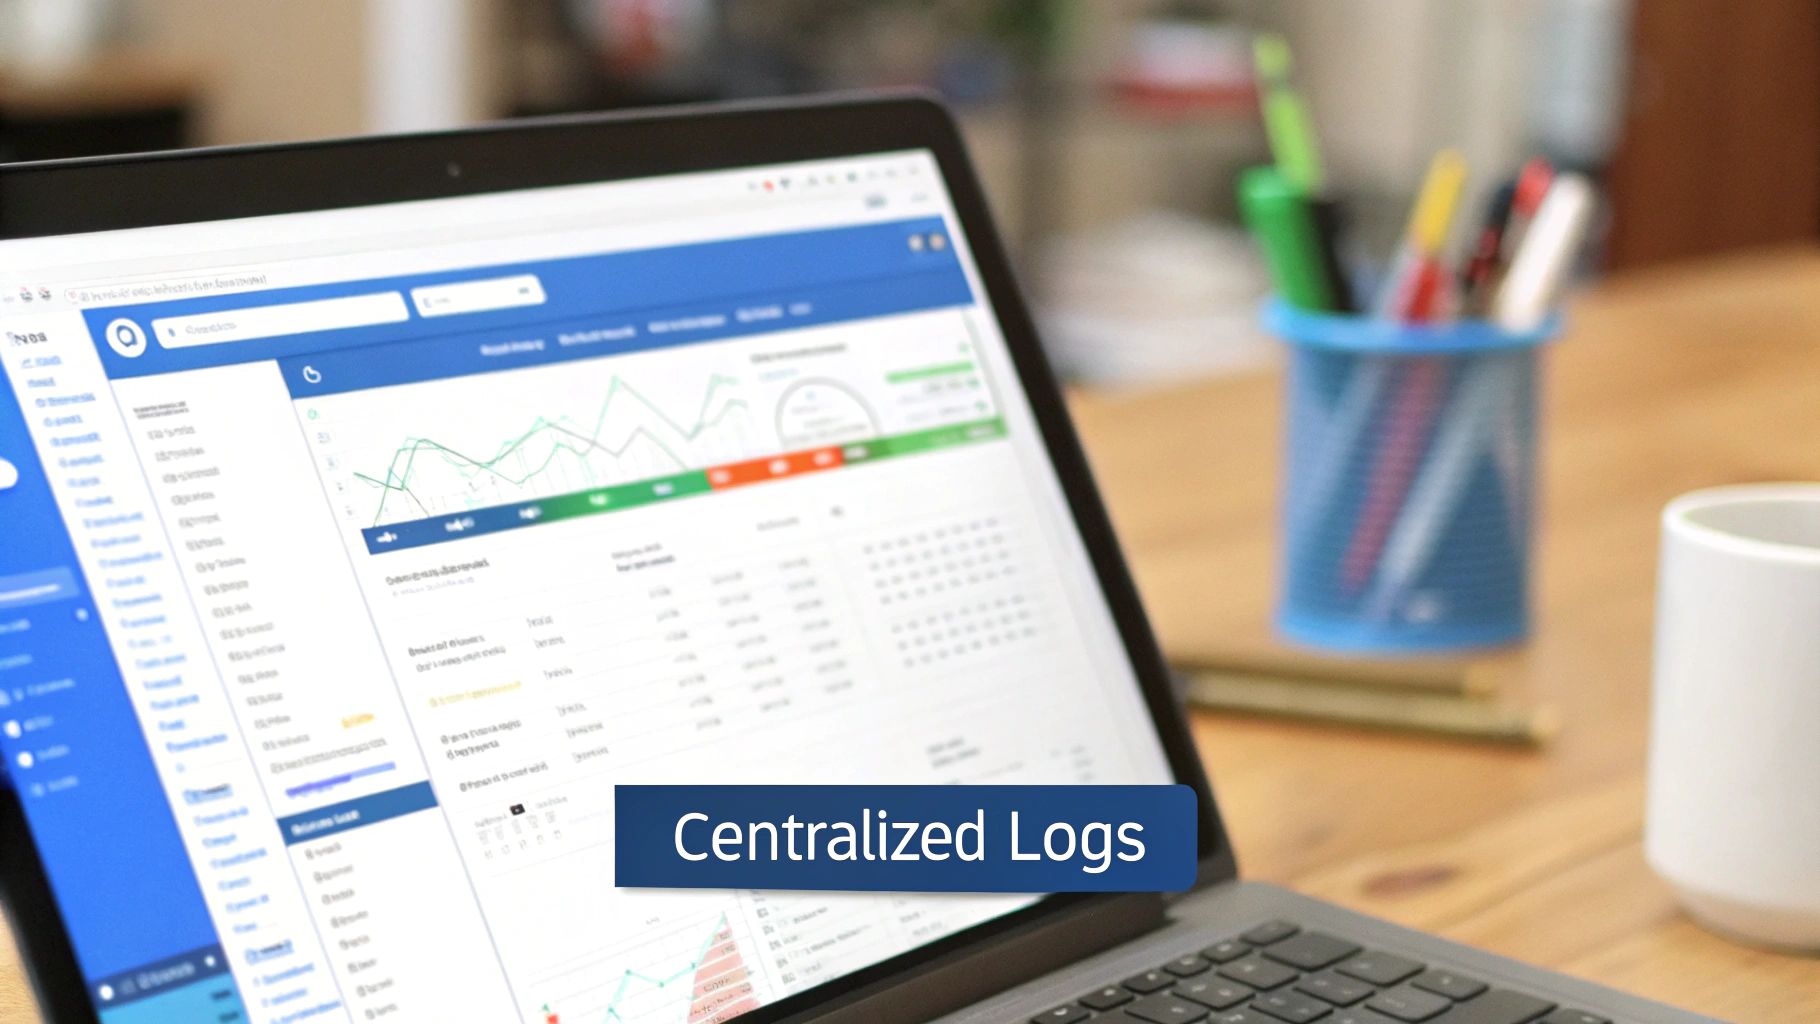
4. Implement Comprehensive Logging and Centralized Log Aggregation
While metrics provide the "what" and "when" of an issue, logs provide the crucial "why." Comprehensive logging involves capturing detailed, time-stamped event records from every layer of your infrastructure, from network switches and operating systems to applications and microservices. By itself, this data is siloed and difficult to parse. The real power comes from centralizing these logs into a single, searchable repository, turning a chaotic flood of text into a powerful tool for troubleshooting and security analysis.
Centralized log aggregation allows you to correlate events across a distributed system to pinpoint the root cause of complex failures. For instance, a SaaS platform can trace a single customer-facing error back through 50 different microservices by following a unique request ID. This transforms incident response from a guessing game into a methodical investigation. Effective logging is a cornerstone of modern infrastructure monitoring best practices, enabling deep visibility into system behavior, security posture, and application performance.
Actionable Tips for Implementation
- Adopt Structured Logging: From the very beginning, implement structured logging formats like JSON. Instead of ambiguous, free-form text, structured logs use key-value pairs (
{"level": "error", "user_id": "12345", "error_code": "DB500"}), making them machine-parseable, searchable, and dramatically easier to analyze and visualize. - Use Correlation IDs: Generate a unique ID at the entry point of a request (e.g., your load balancer) and pass it through every subsequent service call. This allows you to filter your centralized logs to see the complete, end-to-end journey of a single transaction across your entire stack.
- Establish Clear Log Levels and Retention Policies: Define what each log level means for your organization. ERROR should signify an actionable problem, WARN a potential issue, and INFO only significant business events to avoid noise. Implement tiered retention policies: store logs in fast, "hot" storage for 7 days, move to "warm" storage for 30-90 days, and archive to cheaper "cold" storage for long-term compliance.
- Sanitize All Logged Data: Never log sensitive information like passwords, API keys, or personally identifiable information (PII) in plain text. Implement automated redaction or masking rules within your application or logging agent to prevent security breaches and ensure compliance.
- Monitor Your Logging Pipeline: Your log aggregation system is a critical piece of infrastructure. Monitor its health, throughput, and query performance to ensure it doesn't become a bottleneck during a major incident. An unavailable logging platform is a massive blind spot when you need visibility the most.
5. Establish Performance Baseline Metrics and Capacity Planning
Effective infrastructure monitoring is not just about catching failures; it's about understanding what "normal" looks like. Establishing performance baselines involves collecting and analyzing historical telemetry data, such as CPU, memory, network bandwidth, and storage IOPS, to define your system's typical operating parameters. This historical context is the key to moving beyond simple threshold alerts, allowing you to detect subtle performance degradation and accurately forecast future capacity needs.
Without a baseline, it's impossible to know if a 70% CPU utilization is a sign of a healthy peak or an impending outage. By understanding your infrastructure’s performance patterns, you can right-size resources, control costs, and make data-driven decisions about scaling. This practice is a cornerstone of proactive infrastructure monitoring best practices, enabling teams to justify hardware upgrades or consolidations with concrete evidence and align technology resources with business growth projections.
Actionable Tips for Implementation
- Calculate Percentiles, Not Just Averages: Averages can hide critical outliers. Measure p95 and p99 percentiles for metrics like latency and response time to understand the experience of your most affected users. A stable average latency can easily mask brief but severe spikes that impact user satisfaction.
- Account for Business Seasonality: Your baseline is not static. A SaaS platform will have different "normal" traffic patterns during a holiday season or a major industry event. Incorporate these business cycles into your models to avoid false positives during predictable peak periods.
- Use Granular and Long-Term Data: Collect metrics at multiple granularities, such as 1-minute for real-time analysis and 1-hour for long-term trend analysis. For instance, a gaming provider might use 1-minute data to manage evening peak loads while using daily data to plan for server expansion over six months.
- Integrate Forecasting with Business Planning: Share capacity forecasts with product and business teams. If a SaaS company's data shows CPU utilization growing 15% month-over-month, the infrastructure team can proactively schedule a hardware refresh for the next quarter, ensuring performance keeps pace with user growth.
6. Implement Automated Health Checks and Self-Healing
Mature infrastructure monitoring best practices extend beyond alerting humans to taking automated corrective action. Automated health checks and self-healing systems form a powerful feedback loop where the monitoring system not only detects a problem but also triggers a pre-defined, automated response to resolve it. This approach is designed to handle common, transient failures like a crashed container or a non-responsive application server without requiring manual intervention, significantly improving resilience and Mean Time To Recovery (MTTR).
The goal is to build an environment that can automatically recover from known failure modes. For example, a load balancer's health check can detect a failed API server and instantly remove it from the active pool, rerouting traffic to healthy instances. Similarly, an orchestration platform like Kubernetes can automatically restart a crashed container or replace an entire failed node. This proactive, automated remediation is what separates a merely monitored system from a truly resilient one, ensuring services gracefully degrade or recover before users even notice an issue.
Actionable Tips for Implementation
- Go Beyond Basic Connectivity Checks: A simple TCP check or ping is not enough. Implement deep health checks that test actual application functionality. For an API server, the health check should make a lightweight API call that validates database connectivity and returns an expected response, not just confirm that port 443 is open.
- Utilize Circuit Breakers: In a microservices architecture, when a downstream service fails, continuing to call it can cause cascading failures (a "thundering herd"). Implement a circuit breaker pattern where repeated failures from a health check will temporarily "trip the breaker," causing requests to that service to fail fast, giving it time to recover.
- Make Checks Idempotent and Efficient: Health checks run frequently, sometimes multiple times per second. Ensure they are lightweight and idempotent, meaning they can be executed repeatedly without causing unintended side effects like writing duplicate log entries or altering state.
- Log All Health Check Outcomes: Don't let health checks operate silently. Log their status changes (e.g., from
healthytounhealthy) and the reasons for failure. This historical data is invaluable for debugging intermittent issues and identifying patterns in component failures. For example, customers can use load balancer health checks to automatically remove failed bare metal servers from a pool, and the logs provide a clear record for post-incident analysis.
7. Monitor Network Performance and Quality of Service (QoS)
Application performance is fundamentally tied to the health of the underlying network. Proactive network monitoring goes beyond simple up/down checks to measure the actual Quality of Service (QoS) your users and services experience. This involves tracking key metrics like latency, jitter, packet loss, and bandwidth utilization across your entire infrastructure, from intra-datacenter links to inter-region connections and public internet paths. The goal is to identify and resolve network bottlenecks, congestion, and routing anomalies before they degrade application performance.
Effective network monitoring provides the context needed to correlate application behavior with network events. A sudden spike in application error rates might be caused by a BGP route change that adds 50ms of latency, or a saturated carrier link could be the root cause of slow API responses. This level of visibility is a cornerstone of modern infrastructure monitoring best practices, enabling teams to distinguish between application-layer and network-layer problems, which significantly speeds up incident resolution.
Actionable Tips for Implementation
- Measure Latency Percentiles, Not Just Averages: An average latency of 30ms can hide a critical problem where 5% of requests take over 300ms. Monitor tail latency percentiles like p95 and p99, as these often represent the most frustrated users and are better indicators of intermittent congestion or routing issues.
- Establish Latency Budgets for Service Boundaries: Define and enforce maximum acceptable latency for communication between different microservices or application tiers. For instance, a web front-end should have a latency budget of less than 2ms when communicating with its caching tier. Alert when this budget is exceeded.
- Implement Synthetic Probes: Continuously verify network paths and performance between critical locations, such as between two data centers or from regional points-of-presence to your core infrastructure. These synthetic tests can detect routing problems or performance degradation before they impact production traffic. A gaming platform, for example, can use this to monitor latency to its regional server clusters.
- Correlate Network and Application Metrics: In your observability platform, overlay network metrics (like packet retransmits) with application metrics (like API error rates). This correlation makes it immediately obvious when a network issue is the root cause of an application failure, avoiding wasted time investigating the wrong components.
8. Implement Proactive Security Monitoring and Threat Detection
Modern infrastructure monitoring best practices must extend beyond performance and availability to include security. Proactive security monitoring involves continuously analyzing telemetry data from across your stack to identify and neutralize threats before they escalate into breaches. This means collecting and correlating network traffic patterns, system logs, file integrity data, and user authentication events to detect intrusion attempts, unauthorized access, and malware activity. The goal is to shift from a reactive, post-breach cleanup to a proactive, real-time defense posture.
An effective security monitoring strategy transforms raw security data into actionable intelligence. By establishing a clear baseline of normal behavior, you can deploy powerful anomaly detection to spot deviations that signal a compromise. For example, a financial services platform might detect unusual API access from a new geographic region, or a SaaS provider could identify a data exfiltration attempt by spotting abnormally large outbound data transfers. This level of visibility is crucial for protecting critical assets and maintaining customer trust.
Actionable Tips for Implementation
- Establish Behavioral Baselines: You cannot detect anomalies without first defining what is normal. Use monitoring tools to model legitimate traffic patterns, user access behaviors, and system processes. This baseline becomes the foundation for high-fidelity alerts when deviations occur, such as an administrator logging in outside of normal business hours.
- Integrate Threat Intelligence Feeds: Enhance your detection capabilities by integrating reputable threat intelligence feeds. These feeds provide up-to-date information on new attack signatures, malicious IP addresses, and known command-and-control servers, allowing your security tools (like an IDS/IPS) to block emerging threats automatically. For a deeper dive, explore these network security best practices.
- Automate Tier-One Response: Automate responses to clear-cut, high-confidence threats to reduce manual toil and accelerate containment. For instance, an automated workflow can instantly block a source IP address exhibiting brute-force login attempts or revoke a user token associated with suspicious activity, freeing up your security team to focus on more complex investigations.
- Conduct Regular Attack Simulations: Don't wait for a real attack to test your defenses. Periodically run controlled attack simulations (penetration testing or red team exercises) to validate that your monitoring and alerting systems work as expected. These tests help identify blind spots and ensure your response runbooks are effective.
9. Document Infrastructure Architecture and Maintain Updated Runbooks
A sophisticated monitoring system loses its value if the on-call team doesn't understand the infrastructure or know how to respond to an alert. Documenting your architecture and maintaining runbooks transforms tribal knowledge into a scalable, operational asset. This practice involves creating detailed diagrams of your infrastructure, mapping dependencies, and codifying the exact steps required to handle common incidents and operational tasks. The goal is to empower any team member, regardless of seniority, to respond to issues quickly, consistently, and correctly.
This discipline is a cornerstone of modern infrastructure monitoring best practices, directly bridging the gap between an alert firing and successful remediation. For example, a gaming provider can use a runbook to recover from a server failure in minutes instead of hours, or a SaaS platform can enable a junior engineer to execute a complex database failover by following a pre-approved, tested procedure. This systematically reduces reliance on specific senior engineers and minimizes human error during high-stress situations.
Actionable Tips for Implementation
- Integrate Documentation into Your Workflow: Make documentation a mandatory part of your change management or CI/CD process. No new service or infrastructure change should be deployed without corresponding updates to architecture diagrams and runbooks.
- Use Visuals and Version Control: A picture is worth a thousand lines of text. Use tools to create clear architecture diagrams showing data flow and dependencies. Store this documentation in a version control system like Git, alongside your code, to track changes and maintain a history of your infrastructure's evolution.
- Make Runbooks Executable: Go beyond conceptual steps. A good runbook includes the exact commands to be run, code snippets to execute, and screenshots of expected outputs. This removes ambiguity and speeds up execution during an incident.
- Link Runbooks Directly from Alerts: The most effective place for a runbook is right where you need it. Configure your alerting system to include a direct link to the relevant runbook in the alert notification. This gives the on-call engineer immediate access to the solution, saving critical time.
- Schedule Regular Reviews and Tests: Documentation and runbooks grow stale. Schedule quarterly reviews and test them during disaster recovery drills or simulated game days. This practice ensures they remain accurate, effective, and trusted by the team.
10. Conduct Regular Disaster Recovery Testing and Chaos Engineering
Monitoring tells you what your infrastructure is doing now; proactive testing tells you how it will behave when things inevitably go wrong. Disaster Recovery (DR) testing and chaos engineering are practices that move beyond passive observation to actively validate the resilience of your systems. By intentionally introducing controlled failures, from a single server reboot to a simulated regional outage, you can uncover hidden dependencies, test failover mechanisms, and ensure your recovery playbooks are effective before a real crisis hits.
This proactive approach is a cornerstone of modern infrastructure monitoring best practices, shifting the focus from simply measuring uptime to proving recoverability. Instead of hoping your high-availability architecture works, you scientifically prove it. For example, a gaming platform might use chaos engineering to randomly terminate instances within its distributed server cluster during low-traffic periods, ensuring that user sessions are seamlessly transferred without interruption and that automated systems correctly replace the failed nodes. This builds confidence that the system can handle real-world hardware or network failures gracefully.
Actionable Tips for Implementation
- Start Small and Scheduled: Begin your testing journey within scheduled maintenance windows to minimize user impact. Start with simple, isolated experiments like shutting down a non-critical, redundant service or unplugging a network cable from a secondary switch. This builds operational muscle and confidence.
- Measure Recovery Time Objectively: The goal is to improve. Before each test, define your Recovery Time Objective (RTO) and Recovery Point Objective (RPO). Use your monitoring tools to measure the actual time it takes to detect the failure and for automated or manual systems to restore service. Document these metrics to track improvements over time.
- Involve All Relevant Teams: A disaster doesn't just impact engineers. Include operations, support, and even key business stakeholders in DR drills. This cross-functional training ensures everyone understands their role during an incident, from technical remediation to customer communication.
- Use Testing to Refine Runbooks: Every test, whether it passes or fails, is a learning opportunity. Immediately update your runbooks and documentation with the lessons learned. If a failover step was unclear or a command failed, fix it right away while the context is fresh.
- Celebrate Success Publicly: When a complex DR test, like a full colocation facility failover, is executed successfully, celebrate it internally. This reinforces the value of the practice, acknowledges the team's hard work, and demonstrates a strong organizational commitment to reliability.
10-Point Infrastructure Monitoring Best-Practices Comparison
| Solution | Implementation complexity | Resource requirements | Expected outcomes | Ideal use cases | Key advantages |
|---|---|---|---|---|---|
| Comprehensive Real-Time Monitoring & Alerting | High — multi-layer integration and tuning | High — agents, storage, dashboards, on-call staffing | Sub-second detection, reduced MTTR, predictive insights | Mission-critical distributed applications and 99.99% SLA services | Proactive detection, intelligent alerting, runbook-driven response |
| Multi-Layer DDoS Mitigation & Detection | Medium–High — network integration and mitigation orchestration | High — mitigation capacity, scrubbing infrastructure, provider services | Maintain availability during volumetric and app-layer attacks | Public-facing platforms with high traffic (gaming, SaaS, gambling) | Absorbs large attacks, protects origin IPs, automatic scrubbing |
| Redundancy & Geographic Distribution | High — multi-region design, replication, traffic steering | Very high — duplicate infra, cross-region networking, failover tools | High availability, reduced single-point-of-failure, lower user latency | Global services, compliance-sensitive workloads, high-availability apps | Fault isolation, regional failover, better user locality |
| Centralized Logging & Log Aggregation | Medium — log pipelines and indexing setup | High — storage, indexing, retention and search compute | Faster root-cause analysis, forensic evidence, auditability | Security investigations, complex distributed troubleshooting | Correlated insights, compliance support, searchable audit trails |
| Performance Baselines & Capacity Planning | Medium — metrics collection and statistical analysis | Medium — TSDB, dashboards, analytics tooling | Proactive scaling, cost optimization, regression detection | Capacity planning, cost control, predictable growth environments | Right-sizing infrastructure, accurate forecasting, SLA validation |
| Automated Health Checks & Self‑Healing | Medium — probes, automation and LB/service discovery | Low–Medium — automation tooling, health endpoints | Rapid recovery from transient failures, fewer manual interventions | Microservices, auto-scaling clusters, CI/CD rollouts | Reduces MTTR, prevents cascading failures, enables safe rollouts |
| Network Performance & QoS Monitoring | Medium — protocol probes, BGP and path analysis | Medium–High — probes, collectors, global vantage points | Early detection of network bottlenecks and route issues | Carrier-neutral colocation, multi-ISP setups, latency-sensitive apps | Isolates network vs app faults, detects BGP issues, SLA verification |
| Proactive Security Monitoring & Threat Detection | High — detection pipelines and expert tuning | High — traffic capture, logs, skilled security analysts | Early breach detection, forensic data, faster containment | Regulated industries, data-sensitive platforms, high-risk apps | Detects intrusions, supports compliance, enables automated response |
| Documentation & Updated Runbooks | Low–Medium — disciplined processes and diagrams | Low–Medium — documentation tools and maintenance time | Faster incident response, consistent procedures, better onboarding | Teams with turnover, complex systems, on-call operations | Knowledge transfer, standardized incident handling, reduced mistakes |
| Disaster Recovery Testing & Chaos Engineering | High — planning, safe tooling, cross-team coordination | Medium–High — test environments, time, operator involvement | Validated resilience, discovered dependencies, improved recovery | Mission-critical infrastructure, multi-region architectures | Proves failover, trains teams, uncovers hidden failure modes |
Building Your Foundation for Scalable Performance
Navigating the complexities of modern infrastructure requires more than just powerful hardware; it demands a strategic, proactive, and deeply integrated approach to visibility and control. The journey from reactive troubleshooting to predictive, automated operations is built on a foundation of robust infrastructure monitoring best practices. Throughout this guide, we have explored the essential pillars that transform a collection of servers and network devices into a resilient, high-performance ecosystem.
Adopting these practices is not a one-time setup but an ongoing commitment to operational excellence. Each principle, from establishing intelligent alerting thresholds that reduce noise to implementing proactive chaos engineering exercises, contributes directly to a more stable, performant, and secure system. Mastering these concepts creates a virtuous cycle: enhanced visibility from centralized logging and real-time metrics leads to faster, more accurate incident response. This efficiency, in turn, frees up valuable engineering resources for proactive improvements like performance tuning, automated self-healing, and strategic capacity planning.
Synthesizing the Core Principles
Let's distill the key takeaways from our exploration of infrastructure monitoring best practices into actionable themes:
- From Reactive to Proactive: The central theme is a shift in mindset. Instead of waiting for an on-call alert at 3 AM, the goal is to use performance baselines, proactive security scanning, and automated health checks to identify and resolve potential issues before they impact users. This means treating your monitoring system as a strategic asset for prevention, not just a tool for reaction.
- Visibility is Non-Negotiable: You cannot manage what you cannot see. Comprehensive logging, multi-layer DDoS detection, and detailed network performance monitoring are not optional extras. For teams managing bare-metal or colocation environments, this deep-level visibility is critical for diagnosing hardware-level anomalies, network bottlenecks, or subtle security threats that cloud-based abstractions often hide.
- Automation as a Force Multiplier: Manual intervention is a bottleneck. The most effective strategies leverage automation at every turn, from self-healing scripts that restart a failed service to automated runbook execution during an incident. This not only accelerates response times but also ensures consistency and reduces the potential for human error under pressure.
- Resilience by Design: True resilience is not about preventing 100% of failures; it is about gracefully handling them when they inevitably occur. This is where practices like designing for redundancy, maintaining detailed runbooks, and conducting regular disaster recovery tests prove their worth. These actions build operational muscle memory, ensuring your team and your infrastructure are prepared for any eventuality.
Your Next Steps to Monitoring Excellence
Implementing this comprehensive list may seem daunting, but the key is to start with a structured, iterative approach. Begin by assessing your current monitoring stack against these best practices. Identify the most significant gaps that pose the highest risk to your business operations. Is it a lack of centralized logging that hampers incident investigation? Or perhaps an absence of automated health checks that leads to prolonged, minor outages?
Prioritize one or two key areas and focus on implementing them well. For example, dedicate a quarter to establishing clear performance baselines and another to automating your top three most common incident response runbooks. This incremental progress builds momentum and delivers tangible value quickly. By systematically integrating these infrastructure monitoring best practices, you empower your teams to operate with confidence, scale without fear, and consistently deliver the reliable, high-performance experience your users demand and deserve.
Ready to build your monitoring strategy on a foundation of rock-solid, enterprise-grade infrastructure? Soraxus provides the high-performance dedicated servers, secure colocation, and always-on DDoS mitigation you need to implement these best practices effectively. Discover how our reliable global platform can empower your team at Soraxus.